凑个热闹:huaixiao:
xtquant连到投研端,调用这个指标到python画图,简单写了个
比自己用python写快多了

- #coding:utf-8
- import datetime as dt
- import matplotlib.pyplot as plt
- from xtquant import xtdata
- xtdata.connect()
- s = '000338.SZ'
- data = xtdata.call_formula(
- formula_name = '薛斯通道', stock_code = s, period = '1d'
- , start_time = '', end_time = '', count = 1000
- , dividend_type = 'front_ratio'
- )
- dates = [dt.datetime.fromtimestamp(x / 1000).strftime('%Y-%m-%d') for x in data['timelist']]
- plt.plot(dates, data['outputs']['sup'], label='sup')
- plt.plot(dates, data['outputs']['sdn'], label='sdn')
- plt.plot(dates, data['outputs']['lup'], label='lup')
- plt.plot(dates, data['outputs']['ldn'], label='ldn')
- plt.xlabel('time')
- plt.ylabel('output')
- plt.title(f'薛斯通道 - {s}')
- plt.xticks(rotation=45)
- plt.legend()
- plt.show()
|
 量化研究--量化交易本地数据交互的方式研究26 人气#量化经典
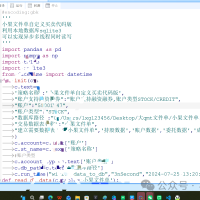 量化研究--量化怎么样实现文件单交易研究20 人气#量化经典
 5分钟跑通一个 QMT 策略,新手少走很多弯路43 人气#QMT投研数据服务
 刚开始学者写代码,出现这个提示,是个什么37 人气#有问必答