[color=rgba(0, 0, 0, 0.9)] 本文来源于公众号“Logan投资”[color=rgba(0, 0, 0, 0.9)]
[color=rgba(0, 0, 0, 0.9)]前一篇推文中,介绍了用numpy加速rolling计算因子的方法。不过演示示例本身其实完全不需要apply,完全可以rolling.mean / rolling.std 来计算夏普,但是我展示的只是个思想,毕竟用rolling.apply去计算其他复杂的因子还是很慢的,所以在本文我尝试了用numpy去加速计算一个前几年较为火热的择时因子RSRS右偏标准分因子,再来做一个实例。 [color=rgba(0, 0, 0, 0.9)]
[color=rgba(0, 0, 0, 0.9)]最终结果比网上公布的代码快了150+倍!!! [color=rgba(0, 0, 0, 0.9)]
[color=rgba(0, 0, 0, 0.9)]指标是基于光大证券研报《基于阻力支撑相对强度(RSRS)的市场择时》,给出了RSRS斜率指标择时,以及在斜率基础上的标准化指标择时策略。 [color=rgba(0, 0, 0, 0.9)]
[color=rgba(0, 0, 0, 0.9)]阻力支撑相对强度(Resistance Support Relative Strength, RSRS)是另一种阻力位与支撑位的运用方式,它不再把阻力位与支撑位当做一个定值,而是看做一个变量,反应了交易者对目前市场状态顶底的一种预期判断。 [color=rgba(0, 0, 0, 0.9)]
[color=rgba(0, 0, 0, 0.9)]其他因子的逻辑不多介绍了,大家可以去看这里
[color=rgba(0, 0, 0, 0.9)]而在聚宽量化社区里也开源了RSRS的计算代码: [color=rgba(0, 0, 0, 0.9)]具体网址: [color=rgba(0, 0, 0, 0.9)]https://www.joinquant.com/view/community/detail/bec17e308647a2160ee1aeeac3a0c40c?type=1
[color=rgba(0, 0, 0, 0.9)]原始RSRS计算代码如下: [color=rgba(0, 0, 0, 0.9)]
- import rqdatac as rq
- from tqdm import tqdm
- rq.init('账号', '密码')
- data = rq.get_price('510330.XSHG', '2023-01-01','2024-01-01', frequency='30m')
- def RSRS(low,high, regress_window: int,
- zscore_window: int, array: bool = False):
- """
- :param
- """
- high_array = high
- low_array = low
- highs = copy.deepcopy(high_array)
- lows = copy.deepcopy(low_array)
- rsrs_beta = []
- rsrs_rightdev = []
- zscore_rightdev = []
- N = regress_window
- M = zscore_window
- for i in range(len(highs)):
- try:
- data_high = highs[i - N + 1:i + 1]
- data_low = lows[i - N + 1:i + 1]
- X = sm.add_constant(data_low)
- model = sm.OLS(data_high, X)
- results = model.fit()
- beta = results.params[1]
- r2 = results.rsquared
- rsrs_beta.append(beta)
- rsrs_rightdev.append(r2)
- if len(rsrs_beta) < M:
- zscore_rightdev.append(0)
- else:
- section = rsrs_beta[-M:]
- mu = np.mean(section)
- sigma = np.std(section)
- zscore = (section[-1] - mu) / sigma
- # 计算右偏RSRS标准分
- zscore_rightdev.append(zscore * beta * r2)
- except:
- rsrs_beta.append(0)
- rsrs_rightdev.append(0)
- zscore_rightdev.append(0)
- if array:
- return zscore_rightdev
- else:
- return zscore_rightdev[-1]
- test = []
- for i in tqdm(range(10)):
- start = time.time()
- ddaa = RSRS(data.low, data.high, 18, 600,array=True)
- end = time.time()
- t = end - start
- test.append(t)
- print(f'原始rsrs代码运行平均用时:{np.mean(test)}')
[color=rgba(0, 0, 0, 0.9)]根据在聚宽网上的代码,用原始的代码计算RSRS并记录运行了10次的平均运算时间。
[color=rgba(0, 0, 0, 0.9)]

[color=rgba(0, 0, 0, 0.9)]可以看到用原始代码运行的话平均需要7.89秒(参数为N=18,M=600)
[color=rgba(0, 0, 0, 0.9)]这是仅对于一个股票计算的,若是根据RSRS在3000只票里选股就要计算很多次,进而花费时间大概是6.575个小时,这对于日频策略来说也够呛了,对于高频一点的策略或者平时的因子分析研究中更不用说了,还是很耗费时间的。
[color=rgba(0, 0, 0, 0.9)]所以接下来上神器,numpy! [color=rgba(0, 0, 0, 0.9)] [color=rgba(0, 0, 0, 0.9)]思想是用numpy矩阵运算实现滚动窗口的批量线性回归和指标计算。代码如下:
- import numpy as np
- from numpy.lib.stride_tricks import as_strided as strided
- def rolling_window(a:np.array, window: int):
- '生成滚动窗口,以三维数组的形式展示'
- shape = a.shape[:-1] + (a.shape[-1] - window + 1, window)
- strides = a.strides + (a.strides[-1],)
- return strided(a, shape=shape, strides=strides)
- def numpy_rolling_regress(x1, y1, window: int=18, array: bool=False):
- '在滚动窗口内进行,每个矩阵对应进行回归'
- x_series = np.array(x1)
- y_series = np.array(y1)
- # 创建一个一维数组
- dd = x_series
- x = rolling_window(dd, window)
- yT = rolling_window(y_series, window)
- y = np.array([i.reshape(window, 1) for i in yT])
- ones_vector = np.ones((1, x.shape[1]))
- XT = np.stack([np.vstack([ones_vector, row]) for row in x]) #加入常数项
- X = np.array([matrix.T for matrix in XT]) #以行数组表示
- reg_result = np.linalg.pinv(XT @ X) @ XT @ y #线性回归公示
- if array:
- return reg_result
- else:
- frame = pd.DataFrame()
- result_const = np.zeros(x_series.shape[0])
- const = reg_result.reshape(-1, 2)[:,0]
- result_const[-const.shape[0]:] = const
- frame['const'] = result_const
- frame.index = x1.index
- for i in range(1, reg_result.shape[1]):
- result = np.zeros(x_series.shape[0])
- beta = reg_result.reshape(-1, 2)[:,i]
- result[-beta.shape[0]:] = beta
- frame[f'factor{i}'] = result
- return frame
- def numpy_rsrs(low:pd.Series, high:pd.Series, N:int=18, M:int=600):
- beta_series = numpy_rolling_regress(low, high, window=N, array=True)
- beta = beta_series.reshape(-1, 2)[:,1]
- beta_rollwindow = rolling_window(beta, M)
- beta_mean = np.mean(beta_rollwindow, axis=1)
- beta_std = np.std(beta_rollwindow, axis=1)
- zscore = (beta[M-1:] - beta_mean) / beta_std
- return zscore
- test = []
- for i in tqdm(range(50)):
- start = time.time()
- numpy_rsrs(data.low, data.high)
- end = time.time()
- test.append(end - start)
- print(f'numpy加速后的rsrs代码运行平均用时:{np.mean(test)}')
[color=rgba(0, 0, 0, 0.9)]这里的RSRS没有进行右偏处理,右偏RSRS在下文中。 [color=rgba(0, 0, 0, 0.9)] [color=rgba(0, 0, 0, 0.9)]运行了50次的平均用时 [color=rgba(0, 0, 0, 0.9)]

可以看到平均运行了约0.05秒,足足快了157.8倍!!!!! 这个速度可能还不足以满足几千只股票的RSRS指标的计算,但是对于研究已经是极大的提速了。若限制1秒以内的延迟上限,再用上多进程multiprocessing,只能满足20~100只标的的RSRS指标的计算,但这也满足宽基指数的分钟级和小时级的择时策略了。 进阶一点就是考虑用DASK框架写成并发过程,用这个函数并发计算几千只股票的因子。 [color=rgba(0, 0, 0, 0.9)] [color=rgba(0, 0, 0, 0.9)]以上是RSRS计算的代码和过程。 [color=rgba(0, 0, 0, 0.9)]而原版RSRS中还对其进行修正为RSRS右偏标准分,而我也复现了出来,搞了好一会儿的高等数学和线性代数。具体运行时间如下,为了减少rolling次数,所以我全部都写在了同一个函数里面。 [color=rgba(0, 0, 0, 0.9)]

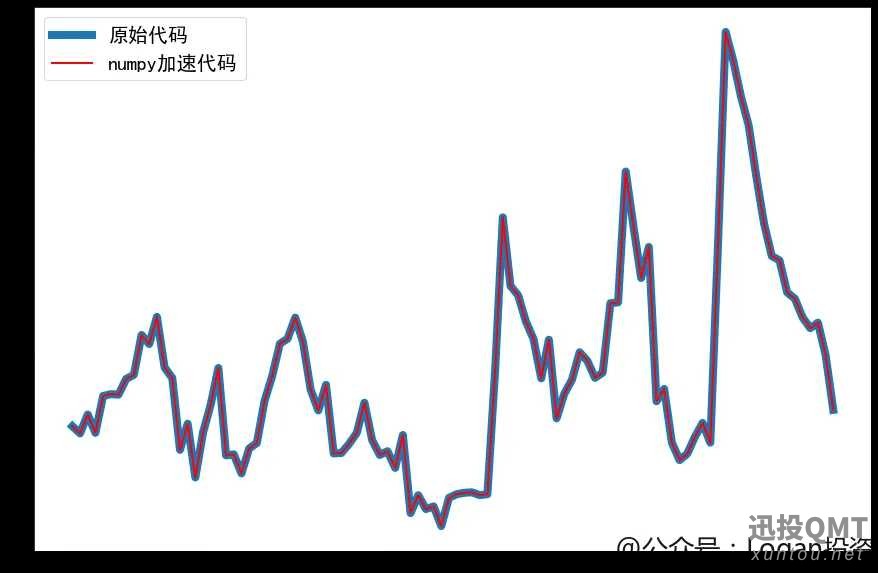
[color=rgba(0, 0, 0, 0.9)]为了展示运行结果的正确性,我挑出numpy加速后的RSRS右偏标准分最后100条数据和原始代码计算的RSRS右偏标准分进行了对比
[color=rgba(0, 0, 0, 0.9)]

[color=rgba(0, 0, 0, 0.9)]蓝色粗线为原始的,覆盖在上面的红色细线是numpy进行计算的。可以看到完全一致,计算结果无误。
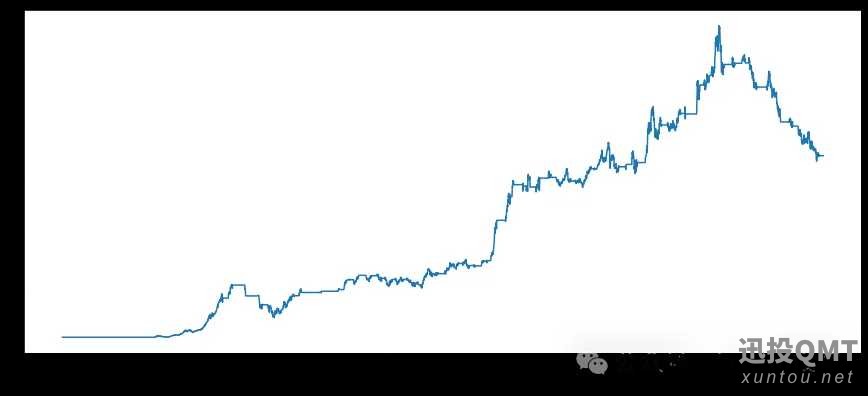
[color=rgba(0, 0, 0, 0.9)]最后附上回测图,RSRS右偏标准分择时指标在近年回撤得比较厉害。
[color=rgba(0, 0, 0, 0.9)]

[color=rgba(0, 0, 0, 0.9)]RSRS右偏标准分的代码有需要的朋友可以在公众号后台私信我“RSRS”即可。
|